Namely Analytics
How to use filters, download reports, and set permissions regarding who can view data in Namely Analytics. In addition, showcasing the types of dashboards in Namely Analytics.
USING NAMELY ANALYTICS
Access Dashboards
To access the Namely Analytics dashboards:
-
Click Analytics on the homepage.
-
Select the dashboard you want to view. You can choose from:
-
Anniversaries and Birthdays
-
Arrivals
-
Attrition
-
Diversity
-
Headcount
-
Job Changes
-
Salary
-
Salary Changes
Filters
All dashboards allow you to filter by department, division, office location, and employee to limit the displayed data to a particular population. Some dashboards include more filters like gender, ethnicity, job title, and manager.
You can also filter by specific dates, depending on the data available in a given dashboard.
-
Anniversaries and Birthdays can be filtered by a specific month.
-
Attrition can display employees' termination dates within a certain date range using the Termination Date filter.
-
Diversity can be displayed for a specific date.
-
Headcount can be displayed for a specific date.
-
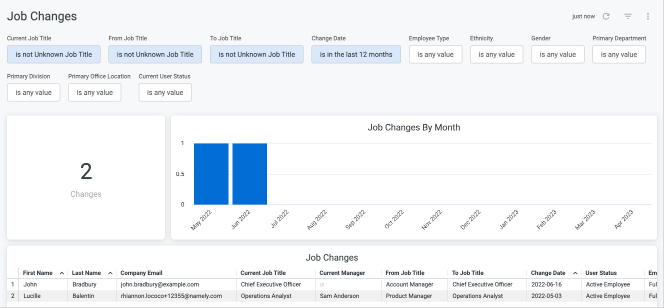
Job and Salary Changes can display employees' changes from a specific point moving forward with the Change Date filter.
-
Salaries can be filtered from a specific date to display a year's worth of data.
To apply a set of filters to a dashboard:
-
Click a Filter.
.
-
Configure your desired variables.
-
Click the + sign to add another variable to a filter.

-
Click Update to apply your filters.
View and Download Data
Your Analytics dashboards display data in chart and graph formats for easy review. As filters are added, the charts and graphs reflect those changes.
To sort a chart by any column, click the column header
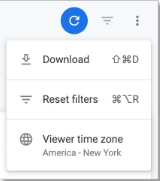
You can also download any data you've configured in your dashboard.
To download:
-
Click the three dots next to data you want to download.
-
Select your preferred file format from the File Format dropdown menu.
-
Click Download to download your data, or Open in Browser to view it in your browser window.
Changes to Employee Data
Analytics takes data from Namely HRIS and Payroll, so there can be a delay in data changes being reflected in Namely Analytics. The exact timing of data sync varies depending on the time of day in which the change was made, but you should expect to see your updates within a day.
CONFIGURING ANALYTICS PERMISSIONS
Analytics permissions can only be configured by users in the Administrator role or by Namely. See Manage Analytics Permissions on User Access Roles for more information.
ANALYTICS DASHBOARDS
Anniversary and Birthday
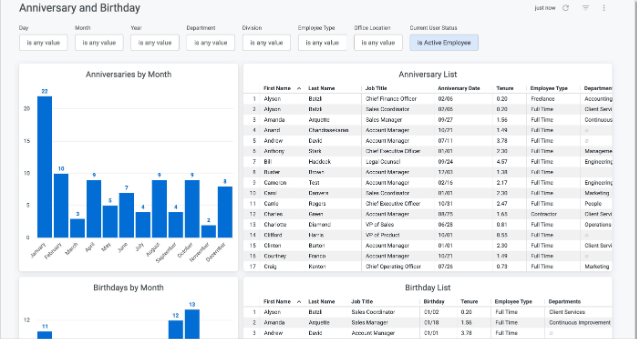
Use the Anniversary and Birthday dashboard to prepare for performance review cycles on employee anniversaries and celebrate employees' birthdays.
Filter by month to review events within a certain period.
Arrivals
The Namely Analytics: Arrivals Dashboard displays employees by their arrival date at your organization. You can view trends by month, department, and apply filters to display arrival data by a specific date range.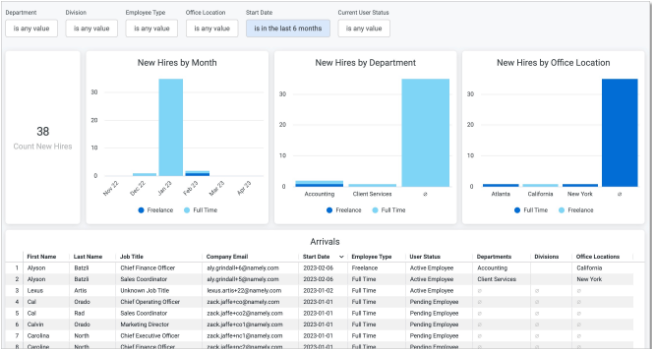
Attrition
Use the Namely Analytics Attrition Dashboard to track trends in employee turnover. You can view trends by year, month, and termination reason, and apply filters to further drill down on your attrition data.
The Termination Reason chart displays all termination reason data in a pie chart.
If your termination reasons in HCM contain voluntary or involuntary tags—such as (v) for voluntary or (i) for involuntary—you can use the Termination Reasons > contains filter to display only voluntary or involuntary departures. 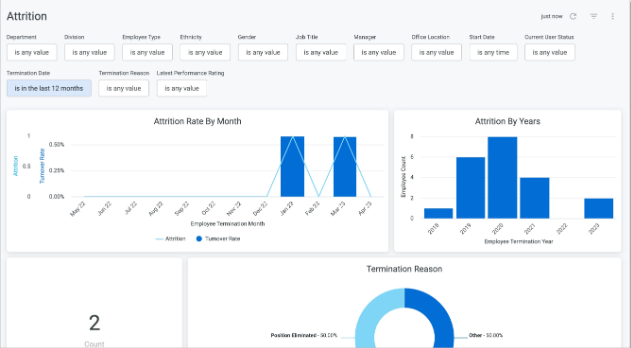
Diversity
The Namely Analytics: Diversity Dashboard provides a point-in-time snapshot of your organization's gender, ethnicity, and age diversity. The dashboard allows you to examine diversity across office locations, departments, roles, and more.
Use the Age Increment filter to adjust year groupings from their default 5-year increments.
Use the Job Title filter to view diversity of employees in leadership positions. Choose job titles
that correspond to leadership roles at your organization.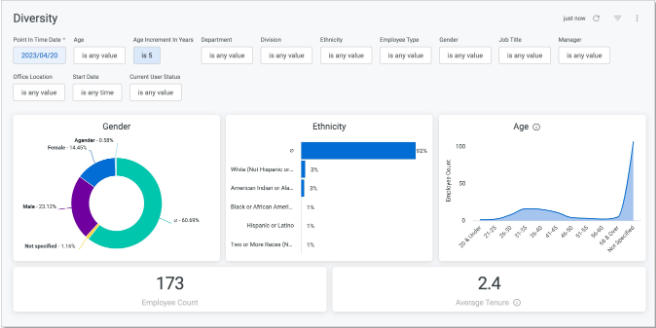
Headcount
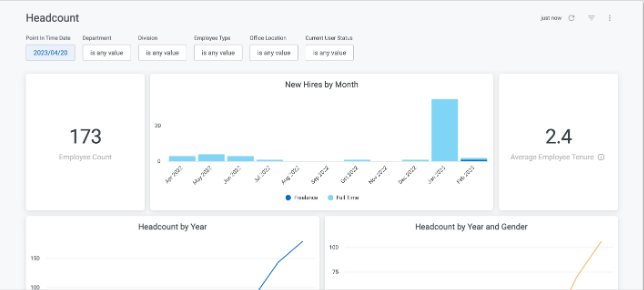
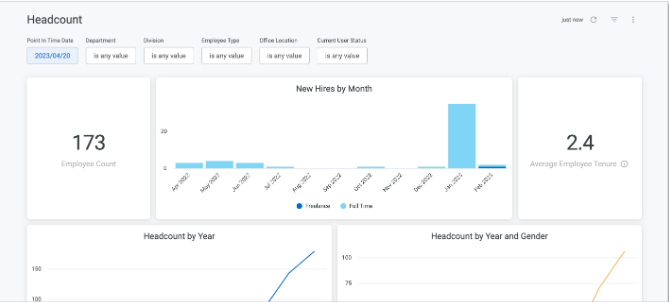
Monitor trends in your employee population with the Namely Analytics: Headcount Dashboard. This dashboard displays your total employee count, start date by month, and average employee tenure in years.
View headcount and headcount change by year, as well as a breakdown of headcount by gender.
Filter by department, division, or location, or pick a point in time to review headcount on that date.
Job Changes
Salary
The Salary dashboard displays total annual salary for your organization over time.
The Total Annual Salary graph displays data for your salaried employees. See your total cost of employees, or filter by job title to review cost for each one. Use the Point in Time filter to display past salary information.
The graph will default to display all currency types.
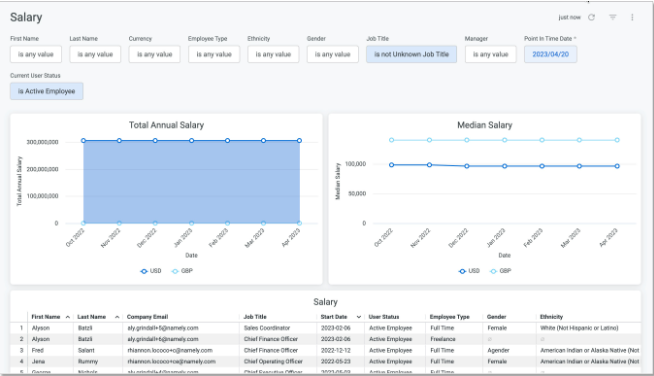
To add or remove currencies from the graph, click the currency type below the display.
Salary Changes
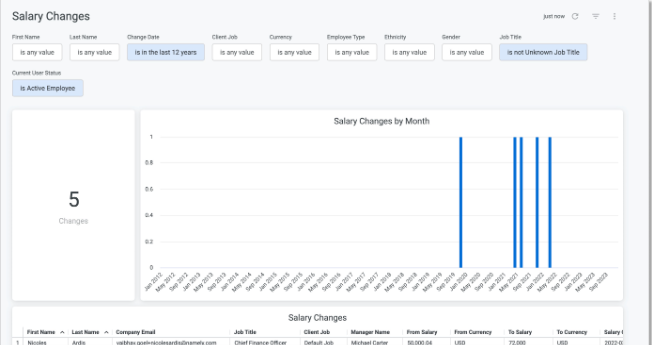
Use the Salary Changes dashboard to review changes to salary by employee. Only salaried employees will be included in this dashboard.
Use the Change Date filter to review raises or promotions within a certain period of time.
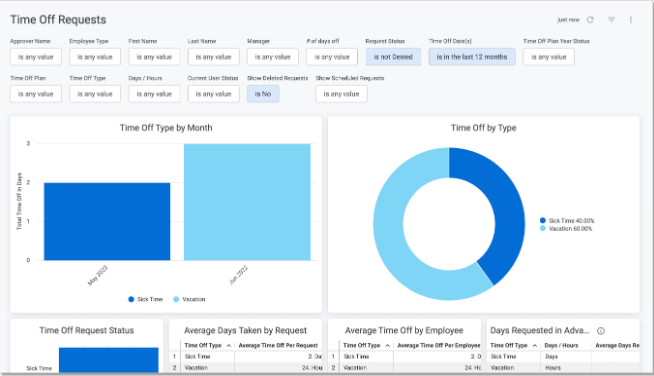
Time Off Requests
TheTime Off Requests Dashboard provides a comprehensive view of trends in your employees’ time off. Use the dashboard’s filters to display specific time off information by approver, plan year, the request’s status, and more.
