How do I pull an Analytics Report?
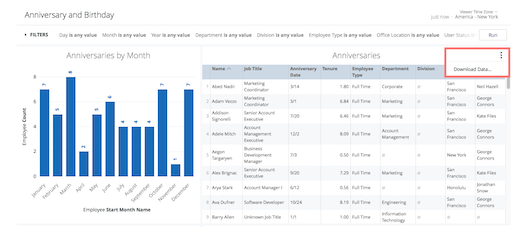
Your Analytics dashboards display data in chart and graph formats for easy review. As filters are added, the charts and graphs reflect those changes.
To sort a chart by any column, click the column header.
You can also download any data you've configured in your dashboard.
To download:
-
Click the three dots next to data you want to download.
-
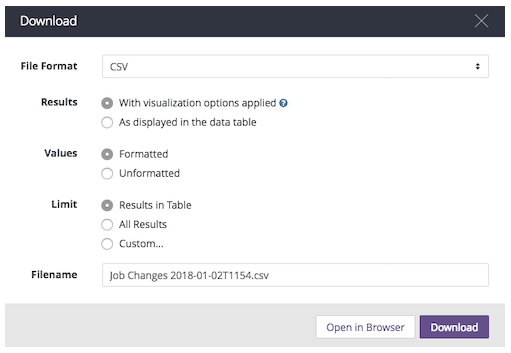
Select your preferred file format from the File Format dropdown menu.
-
You can choose from TXT, Excel, CSV, JSON, HTML, or Markdown.
-
Select whether you want the Results to display with visualizations or as a data table.
-
Select whether you want your data Values to be formatted or unformatted. Unformatted data will not include any rounding or other settings used to display your data in Namely.
-
Select your Limit.
-
Results in Table limits your data to the first 500 rows in the data set.
-
All Results includes all the rows in your data set.
-
Custom allows you to choose which rows you would like to include.
-
Click Download to download your data, or Open in Browser to view it in your browser window.
Analytic reports offer a variety of filtering options, but only pull in a specific, predetermined set of fields.